pixelartvisuals
ActivePixel-art infographics, charts, diagrams and animations for blog posts, drawn on a tiny grid and exported crisp.
About the kit
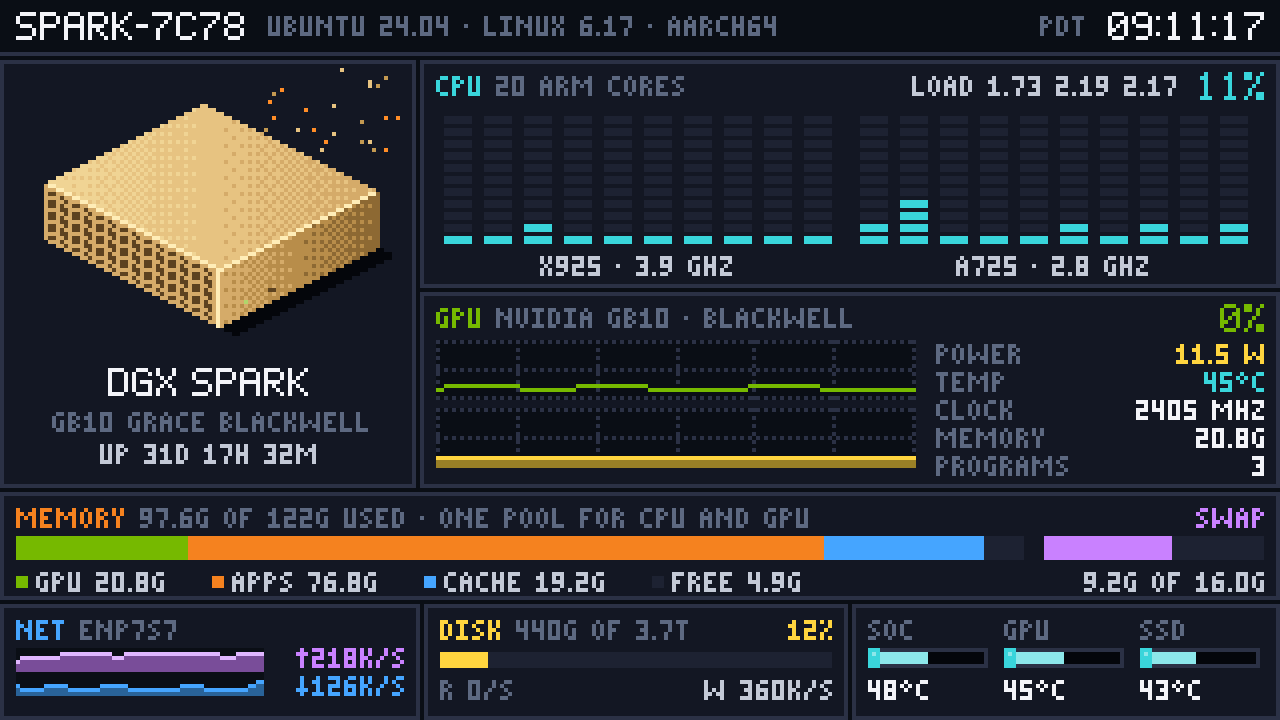
pixelartvisuals draws every graphic on a small canvas, 320 by 180 by default, in whole pixels, then scales it up so each pixel becomes a sharp block. Two bitmap fonts, a navy-and-rainbow palette and a set of parts (striped 3D bars, LED meters, gauges, sparklines, waffle charts, isometric devices) give everything the same retro look.
The same drawing code makes stills and animations. Wrap a drawing in a function of time and the bars rise and the numbers count up.
The repo holds the kit, pixelkit, and the instructions an AI agent follows to make new graphics with it, as a skill for Cursor and Claude Code. The diagrams in this site's devlog were drawn with it.
When nobody's asking for a bar chart it does other things too: a sysop's bedroom in 1992 dialling a BBS, a music tracker, an arcade attract screen, and DOOM, redrawn in the kit's style.